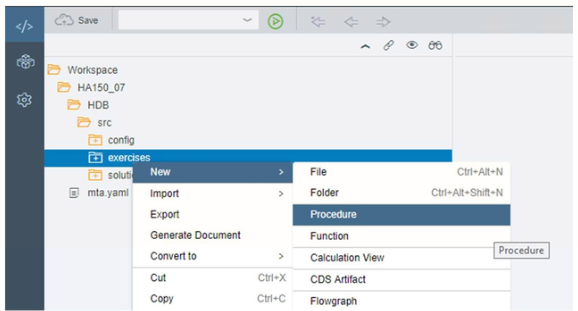
Creating Database Procedure
To Debug Database Procedures
- In the SAP HANA tools/ SAP HANA studio, open the SAP HANA development perspective. You can use menu item Window -> Open Perspective -> Other .. or choose the Open Perspective button in the toolbar. Choose SAP HANA Development in either case.
- In the Project Explorer in the navigation frame on the left, open the context menu and choose New -> Other….in the dialog window, open folder SAP HANA -> Application Development, choose item XS Project and press Next.
- Enter a Project Name, e.g. debug and press next.
- In step share project, press add workspace, choose your SAP HANA system and press Finish.
- Back in step Share project, unflag Add Project folder as Subpackage.
- Press Browse …, choose a repository package, press OK and then Next.
- In step create objects, unflag all checkboxes in the access objects frame and leave the field in the frame Common Objects empty.
- Press Finish.
- Locate the procedure you want to debug in your database schema by opening the project, sub-folder SAP HANA system library -> Catalog.
- Open the procedure in an editor window by double-clicking it.
- In the left-most column of the editor window, double-click on the lines where you want to set breakpoints.
- Open the debug perspective. You can use menu item Window -> Open perspective -> other ..or press the open perspective button in the toolbar. Choose Debug in either case.
- Open the menu of the debug button in the toolbar and choose Debug Configurations
- Choose SAP HANA stored procedures, then open the context menu and choose New.
- Enter a name for the debug configuration
- Choose option Procedure to debug: and catalog schemas in the corresponding dropdown list.
- Press the browse …button navigate to your database schema and the procedure you want to debug, choose it and press ok.
- Press Debug.
The system starts a debugging session and calls the procedure chosen in the debug configuration. Execute stops at the first breakpoint.
You can resume execution until the next breakpoint, terminate the debugging session, inspect the variables values, add breakpoints, and more.