Using the SQL Trace
SQL Trace Execution
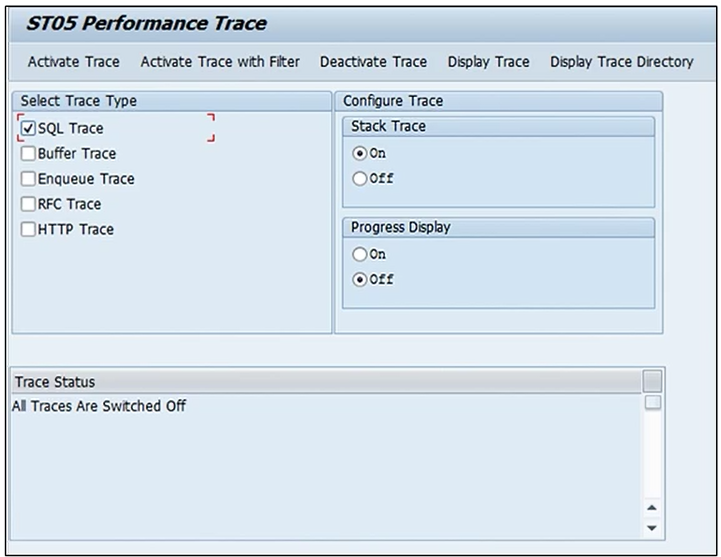
The SQL trace allows you to precisely analyze and track the database accesses that the database interface in the SAP system initiates. This makes the trace an effective tool for performance analysis. To start the SQL performance trace, enter transaction code ST05 or choose System → Utilities → Performance Trace.
SQL Trace List Analysis
There are slight differences in the trace list between the different database systems.
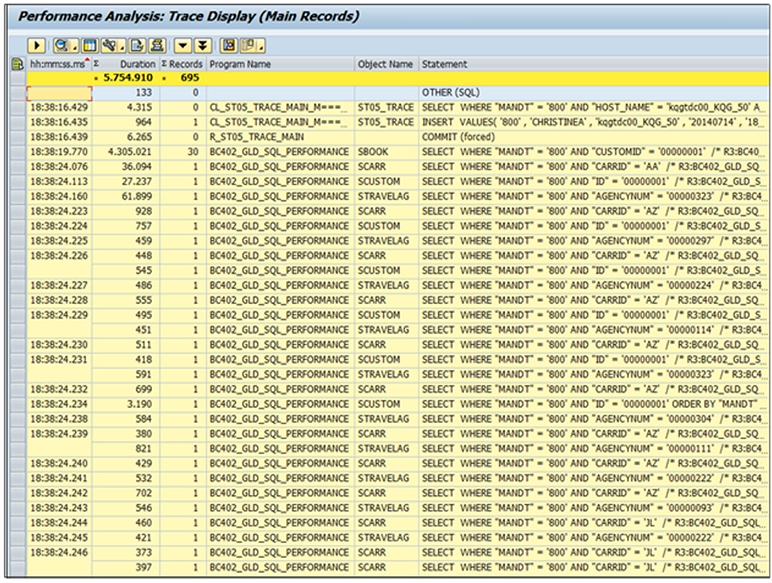
The columns in the expanded trace list have the following meanings:
- Duration
Duration of the database operation in microseconds (depends on the system load) - Object name
Name of the table/ the view from the SQL statement - Records
Number of data records that the database operation supplies - Statement
Text of the observed SQL statement
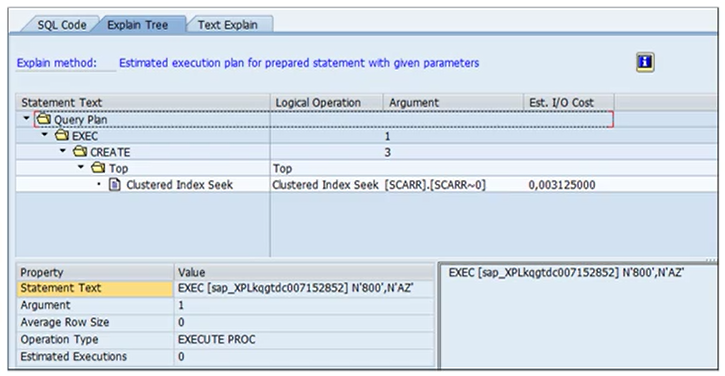
The Display Execution Plan Function
From the main trace file, if you select a SQL statement from the trace list and choose the Display Execution Plan button, the execution plan for that statement will be displayed.
Note that this function is database-specific, and therefore the exact use, functions and presentation of the data vary widely between databases.
The following information can be obtained by using this option:
- Display of the native SQL statement
- Information about the optimizer strategy
- Information about the costs of the access
- The index used by the statement
- Information about the optimizer statistics
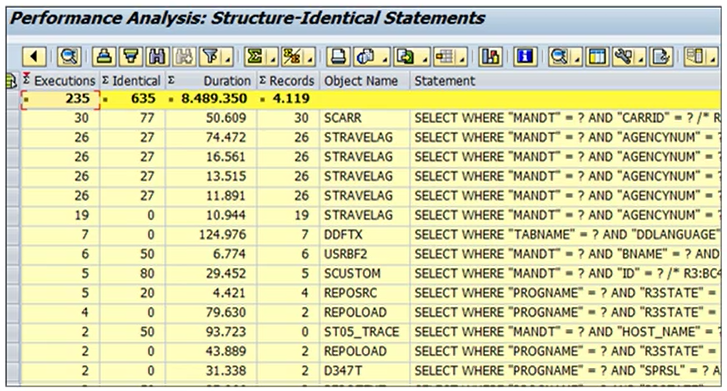
Identical SQL Statements
From within the trace list, to display an overview of how many identically structured SQL statements were performed for the various tables and/or views, choose Trace → Structure-identical Statements . Identically structured statements use the same access strategy, possibly with different values for the bind variables.
The list is sorted by total time required in microseconds.
The list contains the following information for each SQL statement:
- How often was the statement executed?
- How many records were transported (total and average)?
- How much time was required for the access (total and average)?
- Which percentage of the executions was completely identical to a previous execution – that is, with identical values in the bind variables?